Certificate Repricing Forecast
| Screen ID: | IFCDDV-01 | 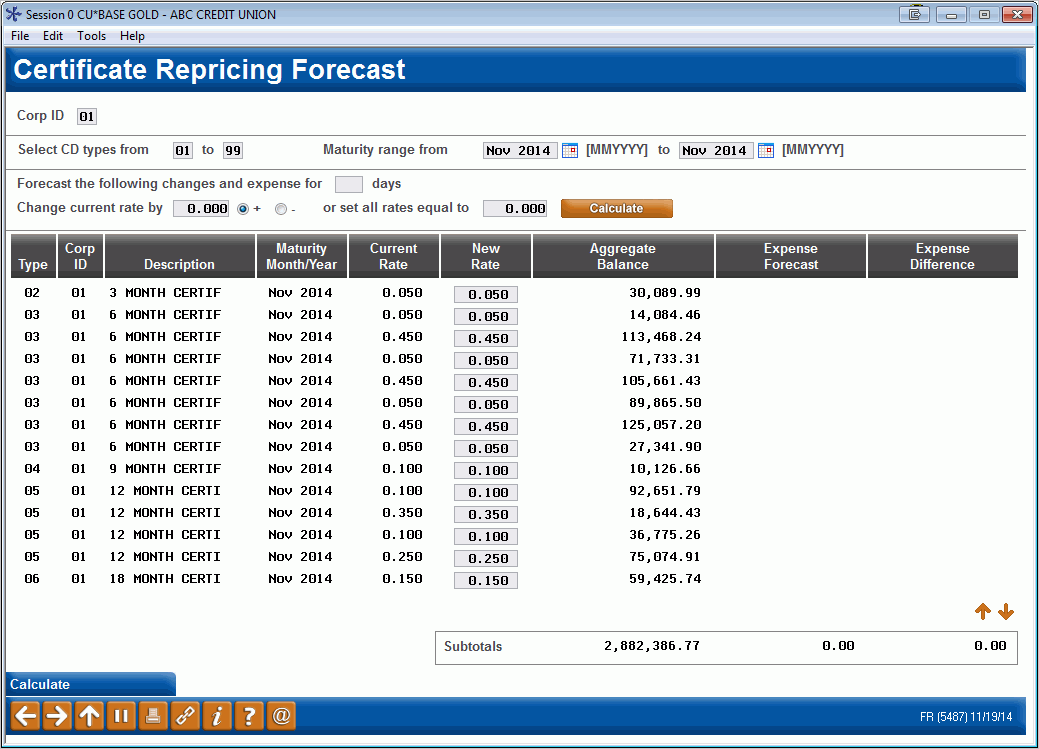
|
| Screen Title: | Certificate Repricing Forecast | |
| Panel ID: | 5487 | |
| Tool Number: | 196 | |
| Click here to magnify |
SEE ALSO: Manager's Notes - Pricing Strategies and CBX Tools
Access this screen by selecting Tool #196: Certificate Repricing Forecast.
The Certificate Repricing Forecast tool is used to calculate the results of maturing certificates combined with “what if” rate scenarios, using actual member data. The tool lets you list certificates that are maturing within a specified date range, and using rate models, calculates the resulting dividend cost for those maturing certificates.
-
For example, this tool would be helpful if you were planning to change the rate for 1-year certificates, and wish to see the result of that change to any certificates coming up for renewal within the next three months.
This is a valuable tool for understanding certificate maturities. By grouping maturing certificates by their current effective rate, and then comparing the cost of the same groups using a new forecast rate, the credit union leader can isolate situations where windfall expense changes may be anticipated. Through using live data and the quantitative results of ALM and market rate changes, the credit union leader can balance the expense versus the desired marketing effects of certificate rates.
No actual changes to member accounts are made; the tool simply lets you forecast what would happen if rates were to be changed.
Setting Up the Forecast
To begin, complete the fields at the top of the screen (described below) and use Enter to display the initial forecast calculation. If different parameters are needed, simply change the fields at the top of the screen again and use Enter to redisplay.
-
If changes are made to individual items using the New Rate column, use the Calculate button (or F5) to recalculate the expense forecast and difference for those items. IMPORTANT: Any time changes are made to the selection fields at the top of the screen, the entire list will be refreshed, and any changes you made to individual rates will be lost. Therefore, it is recommended that you first use the selection fields at the top to get exactly the full list you want, then proceed with any “tweaking” to individual rates in the list, using the Calculate button to recalculate new forecasts.
Sample Scenarios
#1: Analyzing Key Maturity Blocks
In this scenario, you wish to see the dollar amounts represented by every certificate maturing within the next three months. Assuming that the current date is July 2014, you would use the following parameters to see the data:

When the results display, it will be easy to see the key blocks of maturing certificates that represent significant balances.
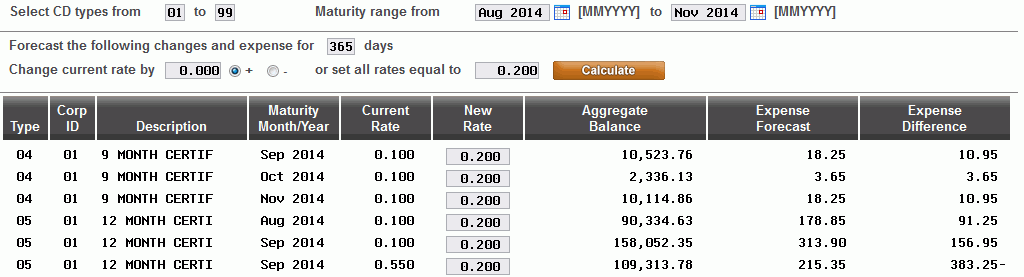
#2: Isolating Key Maturity Blocks and Rate Modeling
By selecting individual CD types that represent key maturity blocks, and forecasting either a deviation or consistent rate, you can measure the effect of different strategies on a single set of certificates.
-
It is easiest to measure the true expense of a maturing block by planning to set and hold a rate over an upcoming time period. Then, by adding together the Forecast Difference per rate block, you can estimate the cost to the credit union over the maturity of the rolling certificates.
For example, say you wish to measure 1-year certificates maturing over the next 3 months. What would the increase or decrease in expense for this block of certificates be for the upcoming year if you held a rate of 2.00% for the entire 3 months?
Assuming that the current date is August 2014, you would use the following parameters to see the data:
-
Notice that savings can be measured over the life of the certificate by entering the number of days equal to the term of the certificate.
Analyzing Rollover Percentages
By measuring key blocks of maturing certificates before and after a certain time frame has passed, the credit union leader can calculate the rollover percentage by comparing the net change of the CDs and the new CDs sold.
For example, on 12/31/04, say that 1-year certificates maturing in the first quarter of 2005 equaled $1.6 million. On 4/1/05, 1-year certificates maturing in the first quarter of 2006 equaled $2.4 million. In analyzing new sales of 1-year certificates during the 1st quarter of 2004, the total was found to be $900,000. Therefore, the rollover total equaled $1.5 million; the rollover percentage is calculated as 93.7%.
$2.4 million - $900,000 = $1.5 million in rollovers
$1.5 million ¸ $1.6 million = 93.7% rollovers
ALM positions will indicate when a credit union needs funding. What is your required rollover percentage this year? Can you control the results? Can you measure the results?
Calculation Details
If you wish to confirm the results of your forecast manually, following is a summary of the calculations used by CBX in this tool:
Step 1
Current Rate ¸ 36500 = Result1C (carried to 9 decimal places, rounded)
Result 1C ´ Aggregate Balance = Result 2C
Result 2C (carried to 9 decimal places, not rounded) ´ No. days to calculate = Current Rate Result
Step 2
New Rate ¸ 36500 = Result 1N (carried to 9 decimal places, rounded)
Result 1N ´ Aggregate Balance = Result 2N
Result 2N (carried to 9 decimal placed, not rounded) ´ No. of days to calculate = New Rate Result (Expense Forecast)
Step 3
Current Rate Result - New Rate Result = Expense Difference
Field Descriptions
|
Field Name |
Description |
|
Corporate ID |
Use this field to work only with products for a specific corporation; leave the field blank to include all corporations. |
|
Select CD types from / to |
Use these fields to enter a range of CD types to be shown in the forecast display. If you need to see only one type of certificate, enter the same number into both fields. |
|
Maturing from / to |
Use these fields to indicate which certificate accounts should be included in the forecast. For example, you could display only those certificates which are maturing (and therefore could renew) within the next three months. Enter a month and year in the From and To fields to indicate the range. Only those certificates with a maturity date within that range will be included in the forecast. |
|
Forecast the following changes and expense for xx days |
Use this field to indicate the number of days for which dividend expense should be shown. For example, if you want to see a month’s worth of dividends, enter 30 here.
|
|
Change current rate by |
To forecast all accounts with a rate either higher or lower than the current rate, enter the rate points here, with a plus sign (+) for an increase, or a minus sign (-) for a decrease.
This tool is primarily theoretical because it assumes the ability to independently price certificates that may be rolling over at the same time. However, it can be helpful for analyzing variable rate certificates where rates are updated incrementally. |
|
or set all rates equal to |
To forecast accounts with a specific rate amount, enter the rate here (use three places past the decimal point).
This tool is practical because you have the ability to control when rates change and when they don’t based upon the credit union’s unique circumstances. Remember that holding or changing the rate will have additional effects on the credit union beyond the simple expense. Measuring the rollover percentage, new sales, and member satisfaction is required to be confident about rate policies. |
|
Typ |
After the forecast has been calculated, this column shows the CD type for each certificate listed.
|
|
Description |
A description of the certificate type.
|
|
Mat Mo/Yr |
The month and year during which the certificates mature. |
|
Current Rate |
The current rate used by the certificates. |
|
New Rate |
This column shows the new rate being used to calculate the forecast amount. This rate is calculated using the amount entered into either the rate deviation or rate amount field above the list.
|
|
Aggregate Balance |
This column shows the total aggregate balance of the certificates within each group. Certificates are grouped both by maturity date and by rate. |
|
Expense Forecast |
This column shows the result of the calculation, using the total aggregate balance of all certificates, at the new rate, for the specified number of days.
|
|
Expense Difference |
This column shows the difference in dividend expense between the Aggregate Balance and the Expense Forecast amounts. |