Dividend/Interest Base Rate Forecasting (2)
| Screen ID: | IFABDV-02 | 
|
| Screen Title: | Average Balance Dividend Forecast | |
| Panel ID: | 214 | |
| Tool Number: | 343 | |
| Click here to magnify |
Access this after pressing Enter on the previous screen.
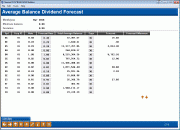
This second screen shows the results of the changes in dividend rates, as requested using the variables on the first screen. Notice that the current average balance for all member accounts is shown, and then calculated with the new rate to show the expense forecast.
The system uses a summation of the Average Daily Balance for each member for each savings product type. This number is represented by the Total Avg Bal column. This balance is the average for the dividend period ONLY.
-
This average balance is displayed in Inquiry in the first screen for each product, in contrast to the average balance displayed in Phone software, which is an average for the past 60 days.
This total may be of interest if you are wondering about the movement of savings dollars over a dividend period. By comparing the movement of the daily Trial Balance total to the average balance total displayed in the analysis, the credit union leader can compare the range of peaks and valleys of a savings product to its average. This average balance is a very accurate number, and based upon several testing periods in a dividend period, should prove to be an important measurement for the credit union’s ALM analysis.
-
NOTE: This average can be skewed if the savings product is configured to have a zero rate with a very long payment term. To allow the system to correctly calculate the rate, the configuration may be set with a zero rate, with the payment frequency and next payment date to be no longer than a quarter. Effectively, this only resets the average balance calculations since the rate is zero.
To modify the forecast for an individual dividend application, enter the new rate into the Forecast Rate field and use F5-Calculate to recalculate the forecast and forecast difference amounts.
Rate Changes vs. Effective Expense
On occasion, credit union leaders get so caught up in ALM and the effective rates paid by other institutions that they change rates with no consideration as to the actual expense effect of the change. In some cases, the marketing value and goodwill effect of rate changes might outweigh the value of the ALM or competitive rate situation. When considering a rate change, ask yourself some important questions: What can the credit union afford? How will the change be marketed? Can we lose more than we gain?
Field Descriptions
|
Field Name |
Description |
|
Apl |
The dividend application code showing the type of product (i.e., share, checking, Christmas Club, etc.). |
|
Corp ID |
The corporation ID for the product. |
|
Rate |
This column shows the current status of the savings product as configured in CU*BASE Savings Product configuration. |
|
Forecast Rate |
This column represents the rate change being compared to the current status. If you selected no deviation on the previous screen, this column will be the same as the Rate column. Now that the model has been generated, you may change each forecast rate individually to recalculate what change in expense this would bring about. After entering one or more new rates in this column, use F5-Calculate to perform the recalculation. |
|
Total Avg Balance |
This column represents the total accumulated average balance of each savings type product. This average is calculated using the current dividend period. |
|
Expense Days |
This column represents the expense period being measured. Once again, if you need to change the period, do so in this column. For example, what would be the difference in compounded expenses between a monthly payment and a yearly one? How would you measure it? After changing the days in this column, use F5-Recalculate to perform the recalculation. |
|
Forecasted Expense |
This column represents the total dividend expense per product based upon the forecast rate, total average balance, and the total days expensed. This forecast amount might be used in accruing the dividend expense for the average balance method, comparing the current accrued amount (daily) to the end of the period forecast, or just to compare “what if” conditions if the forecast rate is different from the configured rate. |
|
Expense Difference |
This column represents the actual dollars and cents difference between the total forecast dividend expenses and the amount that would be paid using the configured rate. Comparing the rates in the Rate and Forecast Rate columns to the expenses in the Forecasted Expense and Expense Difference columns can provide an interesting insight as to the effective change on the credit union’s financials. |