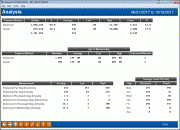
Analysis (Paymentus Bill Pay Payments Dashboard)
| Screen ID: | IBPVCP-10 | 
|
| Screen Title: | Analysis | |
| Panel ID: | 6520 | |
| Tool Number: | 1105 | |
| Click here to magnify |
Access this screen by selecting Tool #1105: Where Your Members Pay Bills (Paymentus) then selecting the "Analysis" button (F16).
Screen Overview
This screen is an analysis of the data selected by the filters on the Payments Dashboard for It's Me 247 Bill Pay (Paymentus) subscribers. At the top of this screen, you will see the time period you selected on the previous screen, which is the time period used when average counts and payments are calculated. If data is selected and also drilled down, such as using the function "All Items This Member", this analysis screen will show only the relevant data for your drilldown selection. If you wish to analyze the data from only your initial criteria, return to the dashboard and use the button "Show All" to clear the additional selection criteria, then return to Analysis.
Field Descriptions
|
Field Name |
Description |
| Top Section | |
| Payment Method | This column lists the payment methods used during the time period of your analysis. |
| Dollars | This column lists the total dollar amount for the payments in the respective payment category for the time period selected. |
| % | This column shows the percentage of the total dollar amount that accounts for the payments made of that payment type. In the screen example shown above, Electronic payments total $1,946,434, which is 69.9% of the total dollar amount of all payments, $2,781,954. |
| Average | This field shows the average dollar amount of the respective payment method during the selection period. |
| Low | This column shows the lowest payment amount of the respective payment category for the selection period. |
| High | This column shows the highest payment amount of the respective payment category for the selection period. |
| Count | This field shows the number of payments made by the respective payment methods during the selection period. |
| % | This column shows the percentage of the total payment count that accounts for the payments made of that payment type. In the screen example shown above, Electronic payments total 6,321, which is 72.4% of the total payment count of 8,730. |
| Middle Section | |
| Payment Method | This column lists the payment methods used during the time period of your analysis. |
| Members | This column shows the number of members that made a payment of the respective type. |
| Age of Membership Average | This column shows the average age of the membership length that have payments of the respective payment types. |
| Age of Membership Low | This column shows the shortest membership length as it relates to the respective payment categories. |
| Age of Membership High | This column shows the oldest membership length as it relates to the respective payment categories. |
| Payments/Member | This column shows the average number of payments per member of the respective payment categories. |
| Bottom Section | |
| Measurement | This column lists the specific measurement metric used in the remaining columns, which calculates data such as the highest number of days between a processed and delivered electronic payment (the High column of the Delivered vs Processed Days (Electronic) label), or the lowest number of electronic payments made during a day in the selection period (the Low column of the Payments Per Day (Electronic) label). |
| Average | This column lists the average number of payments or days, based on the criteria selected. |
| Low | This column lists the low number of payments or processing days, based on the criteria. |
| High | This column lists the high number of payments or processing days, based on the criteria. |
| Day | This column lists the days of the week. |
| Average Count Per Day Electronic | This column lists the average electronic payment count for the specified day of the week, for the time period selection criteria. |
| Average Count Per Day Check | This column lists the average check payment count for the specified day of the week, for the time period selection criteria. |