Credit Score History Analysis (2)
| Screen ID: | ICSHST-02 | 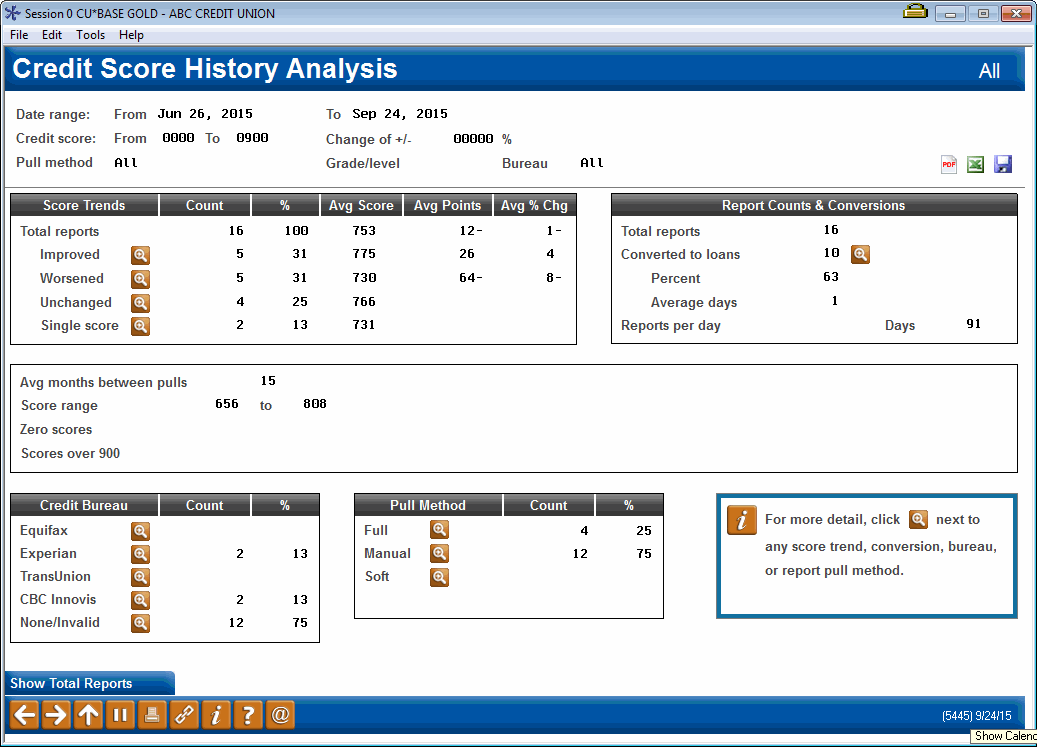
|
| Screen Title: | Credit Score History Analysis | |
| Panel ID: | 5445 | |
| Tool Number: | 319 | |
| Click here to magnify |
Access this screen by selecting Analysis (F11) on the first Credit Score History Analysis screen.
Why am I seeing all 9s in fields on this screen? What are the affected tables?
The analysis screen for the Credit Score History Dashboard is split into six sections:
1. The selection criteria for the group of credit reports is listed at the top. Use the backup arrow to return to the first screen and change your selection criteria.
2. Score trends - this section displays information with respect to how the segment has fared relative to the previous report run for that individual.
-
-
The group is split up into total reports, improved, worsened, unchanged, and single score, and displays the count, percent of total reports, and average score of each sub-segment.
-
For total reports, improved, and worsened, the system will also calculate the average points change, as well as the average percent change.
-
Single score indicates that there is only on credit report on file for that SSN.
-
3. Report counts & conversions - this section displays information related to whether or not the report was converted to a new loan.
-
-
This is determined by looking to see if the credit report is linked to a loan account. If not linked, the system will then look to see if the last loan date is less than or equal to 14 days after the requested date.
-
The system will then calculate the percent of selected loans that were converted to loans, and of those the average days between when the report was run and when the loan was created.
-
The system also calculates the number of days in the selected period and the average number of reports run per day.
-
4. The middle section provides the following information:
-
-
Avg months between pulls - the system will look at all reports in that segment and average the months between each pull and the last report ran for that individual.
-
Score range - gives the high and low values of the group.
-
Zero scores - provides the number of zero scores in the group, if zero scores were included in the first screen.
-
Scores over 900 - lists the number of scores that were over 900. Scores over 900 are not used to calculate averages!
-
5. Credit bureau - breaks the group of credit reports by the bureau used to pull the report.
6. Pull method - breaks the group of credit reports by the pull method (full, manual, or soft)
Clicking the  button in any
section will return you to the first screen and display only the credit
reports associated with that sub-segment of the original group. For example,
if you initially reviewed a group of all reports ran in the last 90 days,
you can enter the Analysis screen and select the
button next to Improvedto return only those reports with an improvement in their credit
score since the last pull. Use Show
Total Reports (F4) to reset back to the selection criteria
originally selected.
button in any
section will return you to the first screen and display only the credit
reports associated with that sub-segment of the original group. For example,
if you initially reviewed a group of all reports ran in the last 90 days,
you can enter the Analysis screen and select the
button next to Improvedto return only those reports with an improvement in their credit
score since the last pull. Use Show
Total Reports (F4) to reset back to the selection criteria
originally selected.
Buttons
|
Button |
Description |
|
Show Total Reports (F4) |
If you entered
the Analysis screen, then selected the |