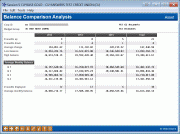
G/L 3-Year Balance Comparison – Statistical Analysis
| Screen ID: | IGLBGT5-03 | 
|
| Screen Title: | Balance Comparison Analysis | |
| Panel ID: | 5540 | |
| Tool Number: | 1018 | |
| Click here to magnify |
Access this screen by using “Analysis” (F15) on the main Balance Comparison dashboard.
- SEE ALSO: Budgeting with CU*BASE
This screen shows interesting statistics about your general ledger accounts for the three years selected on the previous dashboard.
Field Descriptions
|
Field Name |
Description |
|
# months up |
This shows how many of the month-end balances in that year were a net positive change from the previous month. |
|
# months down |
This shows how many of the month-end balances in that year were a net negative change from the previous month. |
|
Average change |
This shows an average change calculated by adding the change amount for each month-end compared to the previous month-end, then dividing by the number of months in the year. |
|
Low balance |
This shows the month that had the lowest month-end balance in that year. |
|
High balance |
This shows the month that had the highest month-end balance in that year. |
|
Average Monthly Balance Q1 Q2 Q3 Q4 Annual |
This shows a calculated average month-end balance for each quarter (3 month-end balance totals divided by 3), and the full year (12 month-end balance totals divided by 12). |
|
# months displayed |
This indicates the number of month-end files that were analyzed for this particular year. If you are viewing the current year, for example, this would show the number of month-ends completed so far this year. For prior years this is usually 12 months but could be less in special situations (such as if your credit union converted during that year and CU*BASE does not have complete history from your previous data processor). |
|
Average monthly balance |
(Same as the annual total above.) |