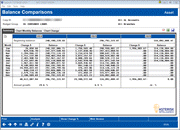
G/L 3-Year Balance Comparison
| Screen ID: | IGLBGT5-02 | 
|
| Screen Title: | Balance Comparisons | |
| Panel ID: | 5538 | |
| Tool Number: | 1018 | |
| Click here to magnify |
This screen appears after making selections on the initial Balance Comparison Selection screen. It will also appear after using the lookup button on any budget year on the 10-Year Trends by GL Account Dashboard.
- SEE ALSO: Budgeting with CU*BASE
This screen displays balances over time for the G/L(s) selected on the previous selection screen. If viewing asset or liability accounts, you’ll see a beginning balance and calculated annual growth for each of the three years, representing the rate of growth from January 1 to December 31 of that year.
The Change $ column shows the dollar amount increase from one month to the next within that same year. Use Show Change to toggle the Change $ columns to show percentage increase (or decrease) instead.
To see some summary statistics for each of the three years, such as average monthly balances and the like, use the Analysis button to display the Balance Comparison Analysis screen.
Use the “Chart”
buttons to see graphs illustrating monthly balances and change amounts
(or percentages). When
done, use the  button
in the lower-right corner of the chart to re-display the dashboard.
Analytics Booth: Web Version
Launching the Web Version (F22) dashboard will provide additional tools to subscribers to analyze data that can only be found in Analytics Booth, including more screen real estate to view more data at one time, different filters and graphics, and new ways to understand the data. Non-subscribers will be presented with a splash page.
Not a subscriber? Learn more in the CU*Answers Store.

|
Check out this video: Analytics Booth at a Glance |