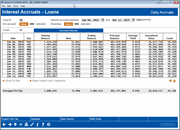
Interest Accruals - Loan Interest
| Screen ID: | IINTALN-05 | 
|
| Screen Title: | Interest Accruals - Loans, Daily Accruals | |
| Panel ID: | 6604 | |
| Tool Number: | 1170 | |
| Click here to magnify |
Access this screen by selecting Tool #1170 Loan Interest Accruals Dashboard from the CU*BASE home page.
Analyzing and trending your interest accrual has never been easier! Daily accrued interest reports have been available within CU*BASE for years; however, the information has often been siloed and difficult to analyze. The Loan Interest Accrual Dashboard takes your daily accrual report to the next level by introducing historical trending, built in analysis, and deeper level of detail providing you with greater insight into your operations and the health of your lending portfolio. This dashboard, along with the remaining accrual analysis dashboards, Certificate Accruals and Shares Accruals, give powerful insight into your credit union's daily accrual activity. As dynamic dashboards with real-time results, these replace the once daily printed reports previously used to convey the information, allowing CEOs and data analysts to view specific analyses for specific GLs, branches, dates, and types.
Note: OTB loan products, 360 calculation type loans, and credit card (Process Type V) loans will not be represented in this dashboard.
Data for this dashboard was first collected on 5/23/2017.
Functions of This Dashboard
-
Trend and annualize your daily accrued interest
-
Assist with Budgeting and Planning
-
Analyze trends within specific loan products or general ledger accounts
For more information on using these dashboards to your full advantage, contact the Asterisk Intelligence team, ai@cuanswers.com.
Search Criteria
|
Field Name |
Description |
|
Corp ID |
Enter the Corp ID. |
|
Interest accrued between MMDDYYY and MMDDYYY |
Enter search dates to generate interest accrual information for that specific period. |
|
GL Account |
Select specific G/L(s) to view (up to 100). The default view of this dashboard is all G/Ls with accrual data available. |
|
Branches |
Select specific branches to view. |
Table Descriptions
|
Field Name |
Description |
|
Date |
The calendar date of the accrual. |
|
Day |
The day of the week associated with the date. This column is helpful in determining what days of the week see more accrual activity on average. |
|
Accrued Interest |
|
|
Starting Balance |
The starting balance of the day in question, for all G/Ls selected. |
|
New |
The amount of interest accrued for the specific day in question, for all G/Ls selected. |
|
Ending Balance |
The ending balance of the day in question, for all G/Ls selected. |
|
Principal Balance |
The total balance of the G/L selection at the time of calculation for this dashboard. Note that these figures are in real time, and the G/L total balance can change when a member makes a payment, etc. |
|
Average Yield |
The average value of interest gained. This weighted average rate is the percentage of the gains on the total sum of loans, within the day selected, for the year. |
|
Annualized Value |
This field lists the calculated value credit union is expected to earn in interest for the year, based on the average yield and account balance at this snapshot moment in time. |
|
Count |
The number of loans included in the G/L selection for that date. |
Functions and Buttons
|
Field Name |
Description |
||
|
Select a day and this link to view the various accrual GL entries for the specific day. |
|||
|
Select this feature to show the loan categories linked to the member G/L accounts used to generate the table information. |
|||
|
Buttons |
|||
|
Export Full List (F9) |
Select this function to export the dashboard list to a file in your credit union's QUERYxx library. |
||
|
Analysis (F16) |
Use the built in Analysis feature to review daily average accrued dividends, averages per certificate, and top general ledger accounts by balance, annualized dividend, and yield. Analyze and trend your interest earnings like never before, brought to you by Asterisk Intelligence. |
||
|
Data Source (F19) |
The Data Sources screen displays the Tables (files) and Columns (fields) that are used to generate the data on the selected dashboard. |
||
|
Web View (F22) |
Launching the Web View dashboard will provide additional tools to subscribers to analyze data that can only be found in Analytics Booth, including more screen real estate to view more data at one time, different filters and graphics, and new ways to understand the data. Non-subscribers will be presented with a splash page.
|
||
