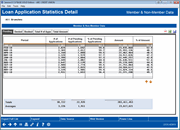
Loan Application Statistics Detail
| Screen ID: | ILNSTA-02 | 
|
| Screen Title: | Loan Application Statistics Detail | |
| Panel ID: | 3131 | |
| Tool Number: | 455 | |
| Click here to magnify |
Access this screen by selecting Detail from the Loan Application Statistics screen.
This screen shows more detail of all the months (or quarters) on the Loan Applications Statistics screen (see link above) broken down by Pending, Denied and Booked loans. Click on the different tabs to view loans broken down by these categories. The Total # Apps tab and the Total Amount tab show graphical representations of this information.
Click F10-Expand for an expanded view including a break down by branch and member/non member.
Analytics Booth: Power Line and Web Version
Launching Web Version will provide additional tools to subscribers to analyze data that can only be found in Analytics Booth, including more screen real estate to view more data at one time, different filters and graphics, and new ways to understand the data. Non-subscribers will be presented with a splash page.
Use Power Line to launch an immediate trend line graph in Analytics Booth to help you better understand your data.
Not a subscriber? Learn more in the CU*Answers Store.

|
Check out this video: Analytics Booth at a Glance |
Column Descriptions
|
Column Name |
Description |
|
Period |
The month (or quarter) used for calculations |
|
Branch |
This stands for Branch. This column is used in expanded view only (when both member and non member data is selected) to designate applications by branch. The branch is the location that the loan application was made. For online applications, this location is generally the member branch. |
|
Member/Non-Member |
This stands for Member/Non Member This column is used in expanded view only (when both member and non member data is selected) to designate applications by member or non member |
|
Total # Applications |
The total number of loan applications processed for that time period (monthly or quarterly). This includes all pending, denied and booked applications. |
|
# Pending/Denied/ Booked Apps |
The total number of applications—either pending, denied or booked (depending on the tab you select) processed for that month (or quarter) |
|
% of Count |
This column shows the % of (pending, denied or booked) loan applications of the total number of loan applications (see the previous two columns). In the example on this topic, there were 726 total applications in September of 2007 and 266 pending applications in that month. This column is 726 divided by 266 or 36.6%. |
|
Amount |
This total dollar amount of applications (pending, booked or denied) processed for that month (or quarter) |
|
% of Amount |
This column uses the number from the Total Amount column and divides that by the grand dollar total for that month (or quarter). This second number is taken from the Total Application Amount column on the Loan Application Statistics screen. If you are on the Pending tab, for example, this shows how much of the total loan application dollar amount comes from Pending applications. |
As for the Total and Averages figures at the bottom of the screen, these are column totals.
-
The first set shows the total and average for the total number of applications for all categories (pending, denied, and booked) for that collected group of months (or quarters). (This figure will remain the same on each tab.)
-
The second set shows the total and average for the number of applications from that specific category (pending, denied, or booked). (This figure will change depending on which tab you are on.)
-
The third set shows the total and average of the total dollar amount for that specific category (pending, denied, or booked). This figure will change depending on which tab you are on.
The Total # of Apps and Total Amount tabs show graphical representation of pending, denied and booked applications for comparison purposes.