Loan Application Statistics
| Screen ID: | ILNSTA-01 | 
|
| Screen Title: | Loan Application Statistics | |
| Panel ID: | 3130 | |
| Data Source: | LNAP, NLNAP | |
| Snap Shot: | þ
As of Month End ¨ Right Now |
|
| Tool Number: | 455 | |
| Click here to magnify |
Access this screen by selecting Tool #455 Loan App Statistics Inquiry.
Dashboard Tips – Questions to Ask When Comparing a Dashboard with Another Dashboard or Report
Introduction to the Tool
-
Have you ever wanted to know how many and what kind of loan applications you processed throughout the course of a year so that you could see trends, either downward or upward? Maybe you wanted to compare the volume of loan applications you have that were pending, denied, or booked during a specific time period. Or even wanted to break this information down even further, to see detailed information about a specific branch or member versus non member activity.
-
This tool (including several screens) displays this information, both in high level and detailed views. The screen defaults to data from the current year, but a selection screen allows for easy adjustment so that you can see just the data you want on your screen. View detail of just one month (or one quarter) or view data over the course of a longer period. The tool breaks down the data by pending, denied, and booked loan applications, and even shows you branch and member/non member activity.
-
You can select dates back to and including August 2007.
What you see on this screen
-
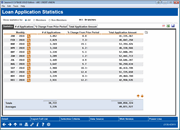
This screen allows you to view loan application data at a higher level and its figures include all data collected from pending, denied and booked applications. (For a breakdown you will need to select one of the detail screens.) The default shows both member and non member data. The selectionsat the top of the screen allow you to select one or the other.
-
At the bottom of the screen, the Totals figure on the left equals the total number of applications (pending, booked and denied) that have been processed during the date range selected. The Average figure on the left equals the average number of applications for the months (or quarters) listed on the screen. On the right, the Totals figure equals the total dollar amount of the all loans during the viewed months (or quarters) and the Average figure equals the average dollar amount for these periods of time.
-
This view defaults to show the months in the current year (ending with the previous months data), but by using Selection Criteria, you can change the months (or quarters) that are shown on this screen.
-
NOTE: When looking at the “% Change From Prior Period” line (both on the Statistics tab and the “% Change From Prior Period tab,” the first line of data will be blank since there is previous data to compare against.
Action Codes
Select a month (or quarter) on the screen and then Select to view a detailed view of the specific month (or quarter) that you have selected. This view shows detail of only the period you initially selected.
Buttons
|
Button |
Description |
||
|
Select this to move to the Detail screen to see detailed information of all the month (or quarters) on the current screen. |
|||
|
Select a month or quarter and use Export to create a database file. |
|||
|
Go to the Selection Criteria screen, where you can select different criteria to determine which the months (or quarters) are shown on this screen. |
|||
|
Select this to view the primary data sources used to generate the dashboard information. |
|||
|
Web Version |
Launching the Web View dashboard will provide additional tools to subscribers to analyze data that can only be found in Analytics Booth, including more screen real estate to view more data at one time, different filters and graphics, and new ways to understand the data. Non-subscribers will be presented with a splash page. |
||
|
Power Line |
Use this button to launch an immediate trend line graph in Analytics Booth to help you better understand your data. Not an Analytics Booth subscriber? Learn more in the CU*Answers Store.
|
