Tracking Products and Services by Member (1)
| Screen ID: | IMBRPS-01 | 
|
| Screen Title: | Tracking Products & Services by Member | |
| Panel ID: | 358 | |
| Data Source: | TIERDL | Click here to magnify |
| Snap Shot: | þ
As of Month End ¨ Right Now Data for these tools is available on the first business day after BOD is run. |
|
| Tool Number: | 697 |
Access this screen by selecting Tool #697 Products & Services Per Member.
-
NOTE: Because this dashboard uses data from a snapshot at the end of the month, activity during the current month will not be included
-
Dashboard Tips – Questions to Ask When Comparing a Dashboard with Another Dashboard or Report
-
SEE ALSO: Knowing Your Members CU*BASE Relationship Management Tools
-
Use Enter on this screen to access the second screen.
Practical Uses for this Dashboard
-
Look at the scoring every month at members who recently opened to see how new members scored – shows opening cross sale prowess.
-
Look at the scoring every month at members who opened 90 days ago and see how these members have improved in the PPM and SPM for proof on how a welcome basket program crossing selling to first quarter Members is working.
-
Look at the scoring every month to consider how longer term members are doing. For example, look at membership opened at least one year, etc.
Introduction
Have you ever wondered whether members who open accounts at your main branch are improving when it comes to products per member (PPM) and services per member (SPM) over time? What is the average PPM during the first month of membership for one branch versus another? Or for one employee versus another? Over time, are these key measurements trending the right way? If one branch tends to have more SPM for new memberships than another branch, might your branch managers have something they could learn from each other?
Whether a branch manager or individual employee, just knowing that it’s possible to get this information quickly might change their behavior.
This tool displays the average PPM and SPM figures from your Tiered Services scoring files. What could tracking PPM and SPM over time mean to your organization?
-
IMPORTANT:Data for this is generated as part of Tiered Service Scoring. So if your credit union does not use Tiered Services, at least for scoring members each month, this feature will not work.
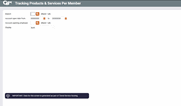
Use this screen to choose which accounts should be included in the inquiry. For example, you might want to examine the trends for current accounts that were opened since you implemented a new sales training program for your MSRs. Or you can view only accounts that were opened at a certain branch or by a specific employee ID. You can also choose whether to display both PPM and SPM numbers on the same screen, or just analyze one thing at a time.
When ready, press Enter to proceed to the second screen.