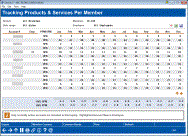
Tracking Products and Services by Member (2)
| Screen ID: | IMBRPS-02 | 
|
| Screen Title: | Tracking Products & Services Per Member | |
| Panel ID: | 360 | |
| Tool Number: | 697 | |
| Click here to magnify |
Access this screen by pressing Enter on the first screen.
SEE ALSO: Knowing Your Members CU*BASE Relationship Management Tools
This screen shows average SPM and PPM figures for a rolling 12 months. (Because scores are gathered at the beginning of each month, that means if you are viewing the inquiry in July, the August - December figures are from the previous year.) The products and services per member that are counted on this screen (as well as the average products per member and average services per member figures) are configured on the Calculating Products and Service screen in Tiered Services.
-
Only currently active accounts are included in this inquiry.
The primary sort on this screen is to add across the row of either PPM or SPM (if displaying both, will use PPM). The member with the highest total (for all 12 months) will be shown at the top of the list, and other accounts likewise in descending order. The secondary sort is the account number.
The idea with this screen is to watch for an upward trend going across several months (remember the rolling 12-month timeframe; this screen is easiest to read during December).
Or you could use this as a type of “sampling” tool to get a list of your top participating members then do some research as to how these memberships were handled, to help determine a pattern that might be helpful when working with other members.
Buttons
|
Button |
Description |
|
Press this option to display the screen that generates this information in printed form. |