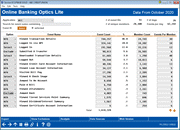
Online Banking Optics: Lite
| Screen ID: | IOLBOPT-01 | 
|
| Screen Title: | Online Banking Optics Lite | |
| Panel ID: | 7053 | |
| Tool Number: | 1100 | |
| Click here to magnify |
Access this screen by selecting Tool #1100 Online Banking Optics: Lite from the home page.

What is Non-Transactional Data?
For many data analysts, member behavior when interacting with the credit union is purely transactional; as a financial services provider, where the money moves indicates where opportunities live. But what about non-transactional data? How do we track and consider member motives when no transaction is made? Online retailers and advertisers, and many marketing and CU leaders among us, see this data collection and interpretation as intuitive – a simple visit to a webpage can highlight ads everywhere else you browse, even if you didn’t buy anything, while data on your usage behavior is collected. Those clues are invaluable to retailers, so what about to credit unions as retailers? Simply put, a non-transactional event is an action that does not result in a transaction, but is providing beneficial insights and data. A credit union member using online banking services is more than just the transaction, it is what they’ve viewed, what they’ve done, and where they are exploring that lends to those same opportunities to improve interactions. The Asterisk Intelligence team’s initiative to engage users with non-transactional data exists on the CU*BASE core as the OLB Optics dashboard, providing data that follows the clicks to show where members are exploring in the online banking environment. This data is vital to analysts as they search for clues and opportunities within member/credit union interaction.
Using This Dashboard
Online Banking Optics Lite dashboard shows what members are doing across online banking applications; personal banking, SLO banking, and MLO banking, even if the activity didn’t result in a transaction. Activity is categorized into Events; examples of events are when a member views a check image, or viewed transaction details, or jumped to an account. You can select multiple events to view or exclude to see where members are spending the most time by number of events and average of events per member, all using the last EOM dataset. Using the Analysis feature will show busiest days of the week, top usage hours and days, which application receives more events, and the top downloads.
-
Hover over any Event Name in the table and see the Event ID.
-
Use the Event ID selection lookup to choose multiple events.
-
Use the drop down option to select or exclude events from the count. Use enter to reset the dashboard after making selections. To view the exclusions, use the Show Exclusions (F15) button.
-
Use the Restore (F5) option to refresh the dashboard and restore all exclusions.
-
Use the Data Sources (F19) button to view the tables and fields used to derive the dashboard data.
-
Use the Analysis (F16) to view an analysis of the selected event information.
Why is This the Lite Version?
Data points that track clicks create a lot of stored data. We are excited to provide options to fully consume and analyze data in a way that only the full optics suite can provide. The full Online Banking Optics scope will be available in the Data Warehouse as a premium data set. Detailed activity records and additional history in the Data Warehouse make it possible for analysts and CU leaders to get specific in analyzing, planning, and managing digital spaces and digital member solutions – including communicating with specific members. To get started with your Data Warehouse, visit the Asterisk Intelligence store: https://store.cuanswers.com/product/data-warehouse-library/
Analytics Booth: Web Version
Launching the Web Version (F22) dashboard will provide additional tools to subscribers to analyze data that can only be found in Analytics Booth, including more screen real estate to view more data at one time, different filters and graphics, and new ways to understand the data. Non-subscribers will be presented with a splash page. Not a subscriber? Learn more in the CU*Answers Store.
What Are the Events and Event IDs?
A lot of data is tracked when a user is engages in online banking. Below is the list of data points that are able to be analyzed via this Optics tool:
ID Description
1 Logged In
2 Forgot Password
4 Viewed Loan Rate Board
5 Viewed New Loan Details
7 Viewed Certificate Rate Board
8 Viewed New Certificate Details
11 Viewed Shares Rate Board
12 Viewed New Share Details
19 Changed Contact Preferences
37 Changed/Created Username
38 Changed Password
41 Changed Security Questions
43 Changed Personal Information
48 Viewed Tiered Services Point S
53 Viewed Transaction Details
54 Viewed Certificate Account Inf
55 Viewed Loan Account Informatio
56 Viewed Credit Card Account Inf
57 Viewed Investment Account Info
58 Viewed A Check Image
59 Printed Loan Coupons
60 Jumped To An Account
61 Jumped Back
65 Created An ACH Distribution
69 Viewed Dividend/Interest Summa
70 Downloaded Transaction Details
71 Viewed Credit Score
72 Scheduled A CFT
75 Scheduled An AFT
78 Scheduled An A2A AFT
81 Submitted A Transfer
82 Submitted An A2A Transfer
83 Added A Check Stop Payment
86 Created A Promise Deposit (no longer used.)
89 Used A Skip-A-Pay Program
92 Visited Bill Pay
93 Created A Payee
94 Paid A Bill
96 Sent A P2P
98 Viewed eStatements
99 Viewed The Newsletter
100 Viewed My Virtual StrongBox
101 Viewed MoneyDesktop
102 Viewed Mobile Web Banking Info
103 Enrolled In Text Banking
105 Unenrolled From Text Banking
111 Clicked On A Smart Message (This feature is no longer available)
112 Clicked A Customized Launch Po
113 Went To PIB
114 Logged Out
116 Logged In via API
117 Visited SavvyMoney Credit Scor
121 Created Password
122 Created Username
123 Created Security Questions
124 Enrolled In P2P
125 Created a Text Transfer Quick
127 Deleted a Text Transfer Quick
128 FIS Scorecard SSO
129 Submitted On Demand ACH