Loan Payments Analysis (2)
| Screen ID: | ILNPMT-02 | 
|
| Screen Title: | Loan Payment Activity Summary | |
| Panel ID: | 5742 | |
| Tool Number: | 468 | |
| Click here to magnify |
Access this screen by pressing Enter on the filter selection screen of the Loan Payments Analysis.
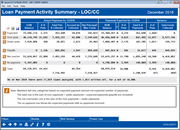
This screen compares actual vs. expected loan payments for the selected period and filters made on the previous screen. In the example shown in the screenshot, May 2015 payments are being compared against what was expected as of the end of April 2016. Since only loans that were expected to have a payment are included, the information is provided below the data:
As of April 2016 there were 13,196 loans analyzed, with 627 written off, for a net of 12,569. (NOTE: The filters for the numbers of loans analyzed include loans where the next payment date is less than or equal to the date analyzed and the maturity date is greater than or equal to the date analyzed.)
Loans are placed in sub-groups based on whether the actual payments were greater than, less than, or equal to what was expected. Further sub-categories (e.g. payoffs and no payment) and totals (net over/under and total) are also provided. For each row, information about payments is presented from left to right showing the expected payment amounts, what was actually received, and the variance.
Select the magnifying glass next to sub-group to go to the account detail level or select Weekly (F16) to see a breakdown of activity by week of the month.
NOTE: Members fall into categories based on expected payment amount not expected number of payments.
Analytics Booth: Power Line and Web Version
Launching the Web Version (F22) dashboard will provide additional tools to subscribers to analyze data that can only be found in Analytics Booth, including more screen real estate to view more data at one time, different filters and graphics, and new ways to understand the data. Non-subscribers will be presented with a splash page.
Use the Power Line (F23) button to launch an immediate trend line graph in Analytics Booth to help you better understand your data.
Not a subscriber? Learn more in the CU*Answers Store.

|
Check out this video: Analytics Booth at a Glance |
Loan Groups
|
Group |
Description |
|
Expected |
Loans for which the actual payment amount that month exactly matched the expected payment amount as of previous month end. A loan that was expected to make one $800 payment will still appear in this section if two $400 payments were made since the actual and expected dollar amount are equal. |
|
Over payments |
Loans for which the actual payment amount made was greater than the expected payment amount as of previous month end. |
|
Under payments |
Loans for which the actual payment amount made was less than the expected payment amount as of previous month end. |
|
Payoffs |
Sub-category of over payments. Loans that were expected to make a regular payment and were paid off instead. |
|
Net over/under |
The sum of over payments + under payments. |
|
No payment |
Loans for which no payment was made despite there being an expected payment. |
|
Total |
The sum of over payments + under payments + expected payments. (Payoffs are included with over payments and no payments are included with under payments.) |
Columns
|
Column |
Description |
|
Actual - EOM Balance |
The resulting EOM balance for the period in question after actual payments were made. |
|
Actual - # of Pmts |
The number of actual payments made. |
|
Actual - Total Pmt $ Collected; Accrued Int Collected; Net Principal/ Misc Funds |
The actual payment amount collected; this is split into interest paid and principal/misc funds in the next two columns. |
|
Expected - BOM Balance |
The balance of loans as of beginning of month. |
|
Expected - F |
Frequency of expected payments. |
|
Expected - # of Pmts |
The total # of payments expected that month. |
|
Expected - Total $ of Payments |
The dollar amount of payments expected for those loans. |
|
Variance - # of Pmts |
# of actual payments made minus # of payments expected |
|
Variance - Total Funds Collected |
Total payment amount collected minus the expected payments. |