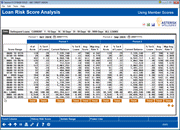
Loan Risk Score Analysis Dashboard (2)
| Screen ID: | IRISK-01 | 
|
| Screen Title: | Loan Risk Score Analysis | |
| Panel ID: | 5065 | |
| Tool Number: | 473 | |
| Click here to magnify |
Access this screen by pressing Enter on the entry screen.
NOTE: Data for this dashboard began populating when the 13.0 release was implemented (April 2013). The file populates at month-end.
This screen will not have data unless search criteria was entered on the entry screen. The dashboard will be left blank if no search criteria are entered.
Dashboard Tips – Questions to Ask When Comparing a Dashboard with Another Dashboard or Report
Data on this screen depends on the selections made on the previous screen.
View a side-by-side comparison of two months data on this screen. The default is the first two months from the entry screen. You can enter any dates in the fields at the top of the screen. They do not necessarily need to be the months entered on the entry screen.
-
This screen lists data by Score Range and Delinquency ranges. Within each Delinquency range (listed in the order entered on the selection screen), is the Risk Score range (listed in the order entered on the selection screen).
-
Sometimes a range will get cut off at the bottom of the screen. In this case place your cursor on the line you want to move and press Enter to move that line to the top of the list so you see everything for that range on the same screen
Trending Data
To Trend on a specific piece of data, click icon at the bottom of the column. This way you can trend data by Current Balance, delinquent loans, etc. The header at the top of the Trending screen will indicate what you are trending by.
Viewing Data by a Specific Delinquency Range
If you would like to only view the data by a specific delinquency range, select a line containing that range and then Isolate Range.
Analytics Booth: Power Line
Use Power Line to launch an immediate trend line graph in Analytics Booth to help you better understand your data. Not a subscriber? Learn more in the CU*Answers Store.

|
Check out this video: Analytics Booth at a Glance |
Button
|
Button |
Description |
|
Use History Risk Score/Use Member Risk Score |
Use this to toggle the between data based on the credit score associated with the membership and the latest score available for the period from the CRBHST (credit score history) file. The title in the upper right indicates which of the scores is being used on the screen. Member Risk Score: Credit score at time of origination History Risk Score: Most recent credit score on file (labeled as such due to the table after which it is derived) |