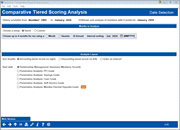
Tiered Services Monthly Comparison
| Screen ID: | ISERV1-01 | 
|
| Screen Title: | Comparative Tiered Scoring Analysis | |
| Panel ID: | 438 | |
| Tool Number: | 856 | |
| Click here to magnify |
Access this screen by selecting Tool #856 Tiered Services Monthly Comparison.
For more information, refer to the Tiered Services implementation guide booklet.
Click here to learn more about using this screen
Dashboard Tips – Questions to Ask When Comparing a Dashboard with Another Dashboard or Report
Interested in comparing a specific group of members to your general population according to the goals of the Tiered Services comparison? Check out the companion "Targeted Tiered Services comparison." Refer to the entry screen of this comparison for more details.
Introduction
This dashboard reports results based scoring from the previous month, so data will not change throughout the current month. If you select March 2013, you will view data from end of month scoring from February 2013.
What is the penetration (participation) within your membership for all of the Tiered Services scoring opportunities?
If your credit union uses the core Tiered Services program, these screens provide a graphical view of the monthly scoring reports (PTSERV-1, PTSERV-2 and LTSSM). Scores from multiple months can be compared side by side, giving you an excellent way to track the progress of your Tiered Services program and how it is motivating members toward more participation.
The average products per member and average services per member figures) are configured on the Calculating Products and Service screen in Tiered Services.
You can even “drill down” to see more about the members in each group, and you can even export the account numbers directly to a file and communicate with those members on the spot through Member Connect!
Using this Screen
The top of this screen lists the range of months for which data is available (History available from).
Select from the two sections at the top of the screen
-
“Quick” which defaults to yearly intervals and the most recent month. (This potentially will show your greatest change, giving you a real sense of your trends.) With “Quick” you also have the flexibility to choose a different interval (monthly or quarterly) and/or to select a different ending month.
-
“Custom” allows you to enter four specific months to compare.
Below this area, you can select to show the months in ascending or descending order. This is how the months will appear on the following screens. Select "Descending" to have the most recent month last.
-
NOTE: On the Summary screen, additional data appears on the final two columns for the previous month. If you select your months to be descending the previous month's data will not be next to these columns.
Additionally, you advance to the specific goal you want to review by using the “Start with” selector at the bottom of the screen. Once you have made your selection, click the Go! button to advance to that specific analysis.
-
Penetration Analysis: PFI Goals
-
Penetration Analysis: Savings Goals
-
Penetration Analysis: Loan Goals
-
Penetration Analysis: Member-Elected Deposits Goals
(For picture of all the goal screens refer to the Tiered Services implementation guide booklet.)
-
Minutes were no longer logged after the first week of December 2007. The system began recording visits (log-ins) as of January 8, 2008.
Analytics Booth: Web Version
Launching the Web Version dashboard will provide additional tools to subscribers to analyze data that can only be found in Analytics Booth, including more screen real estate to view more data at one time, different filters and graphics, and new ways to understand the data. Non-subscribers will be presented with a splash page.
Not a subscriber? Learn more in the CU*Answers Store.

|
Check out this video: Analytics Booth at a Glance |