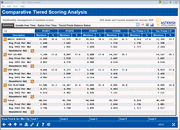
Tiered Services Monthly Comparison (Goals)
| Screen ID: | ISERV1-02 | 
|
| Screen Title: | Comparative Tiered Scoring Analysis | |
| Panel ID: | 4533 | |
| Tool Number: | 856 | |
| Click here to magnify |
Access this screen after selecting four comparison months on the previous screen and using Enter.
Dashboard Tips – Questions to Ask When Comparing a Dashboard with Another Dashboard or Report
-
For more information, refer to the Tiered Services implementation guide booklet.
Interested in comparing a specific group of members to your general population according to the goals of the Tiered Services comparison? Check out the companion "Targeted Tiered Services comparison." Refer to the entry screen of this comparison for more details.
Analytics Booth: Web Version
Launching the Web Version dashboard will provide additional tools to subscribers to analyze data that can only be found in Analytics Booth, including more screen real estate to view more data at one time, different filters and graphics, and new ways to understand the data. Non-subscribers will be presented with a splash page.
Not a subscriber? Learn more in the CU*Answers Store.

|
Check out this video: Analytics Booth at a Glance |
Introduction
This dashboard reports results based scoring from the previous month, so data will not change throughout the current month. If you select March 2023, you will view data from end of month scoring from February 2023.
If your credit union uses the core Tiered Services program, this Summary screen provides a graphical view of the monthly scoring report PTSERV-1 for the months selected on the previous screen. Scores from multiple months can be compared side by side, giving you an excellent way to track the progress of your Tiered Services program and how it is motivating members toward more participation.
-
NOTE: The final two columns on this screen show data on the members scored for the previous month only. The second to last column shows a count of members with zero (or less than zero) Tiered Services points for that month. (It is very infrequent that a member would have a negative score, but these members are included in this column.) The last column shows a count of members who have greater than zero Tiered Services points. You can set members with written off loans to score with zero points.
You can click the lookup next to the tier name to “drill down” to a detail screen to see more data about the members in each group for the prior month. If your credit union uses the household scoring method, click the lookup next to "Household Adj" to view a breakdown of members according to the scores assigned by household (prior month only).
The average products per member and average services per member figures) are configured on the Calculating Products and Service screen in Tiered Services.
Press Enter or use the Goal buttons at the bottom of the screen to move to screens showing data on the five goals for Tiered Services. For more information, refer to the Tiered Services implementation guide booklet.