So What Exactly Are Visual Analytics Tools?
|
|
The Asterisk Intelligence team, partnered with the CU*BASE GOLD team, is proud to present the ever-growing collection of VAT materials within CU*BASE. VAT, or Visual Analytics Tools, are a collection of charts, graphs, presentation screen sizes, and quick save/copy options that make presenting data to an audience crisp, modern, and fully visual. VAT is for anyone who is communicating data visually; not just data analysts, and not just for board reports, but for everyone to share information. VAT is not itself an analysis, but rather a visual support tool for analysis. These charts, graphs, quick copy/save options, and XL screen sizes for presentation are present on dashboard and analysis tools throughout the software.See More About VAT: https://www.cuanswers.com/solutions/asterisk-intelligence/visual-analytics-tools/ |
Using VAT
VAT's simple, user friendly approach makes it easy for anyone to create a beautiful visual display.

|
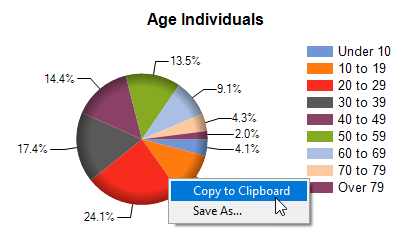
Copy to ClipboardOn any chart in CU*BASE GOLD, right-click anywhere in the chart and choose “Copy to Clipboard” off the menu. This clips out just the chart and its title and is ready to paste into anything you like – an email to staff, a board report, an analysis write-up, etc. This extraction method is intended to make the pre-built GOLD charts simple for you and your staff or analysts to find, use, and share as useful and eye-catching information |
|
Copy Tables from Screen 
While the crux of VAT is the imagery, sometimes it is not the most effective way to communicate the details. If you prefer data tables, or would like to easily and quickly include the source data for a chart you are using from CU*BASE, use this table copy feature to extract the table; this tool allows the user to immediately copy a screenshot of certain data tables in CU*BASE to paste into emails or documents and share or analyze.
Simply click the small copy icon
and the entire table of data on-screen is copied to your clipboard as
an image, including formatting.
Please note that this feature is not available on every table of data in CU*BASE. At this time the feature is attached to data tables that also have at least one chart available.
XL Panel Sizing
Extra large panel sizes are
presentation size CU*BASE screens. When using the Analysis on select dashboards,
you can choose to display them in either standard (1024x768) or extra-large
(1920x1080) size. To select a size, use the  selector
in the lower right corner of the screen to simply click and select either
standard or extra large.
selector
in the lower right corner of the screen to simply click and select either
standard or extra large.
Currently, the following screens support XL panel sizing:
-
Tool #1670 Loan Productivity Analysis Dashboard (one screen)
-
Tool #552 New/Closed/All Accounts Dashboard (five screens)
-
Tool #525 Membership Summary Comparison (three screens)
-
Tool #856 Tiered Services Monthly Comparison (one screen)
-
Tool #557 NSF/ANR Statistics Dashboard (two screens)
Additional Methods of Downloading CU*BASE Data for Visual Analytics
Create full-color PDFs of the data on the screen – PDF Exports
Learn about downloading data to Excel or acomma-delimited file
Method 1: Export Your Data to View in a PDF 
This method allows you to create full-color PDFs of the data that appears on the screen. Learn more about PDF Exports.
Method 2: Downloading Displayed Data to Microsoft Excel 
To pull the data and graphs that are currently displayed on the CU*BASE screen into an Excel worksheet, use the Excel icon.
IMPORTANT: This will NOT pull any records not currently visible, such as if the screen has a list where you must use PageDown to see the remaining records. In that case, use the following method instead to perform the download.
The computer you are working on must have the Excel 2016 or later installed in order for this download feature to work.
NOTE: If you download to Excel from a "Learn from a Peer" dashboard, the default name for each file is the same. Before downloading a second time, you will need to use the Save As feature to save your worksheet to another location - otherwise it will be overridden. If you attempt a second download while an existing download is open, you will receive an error message.
Method 3: Downloading Data to a Comma-Delimited Text File 
To copy this data to a comma-delimited text file, click the Export button that looks like the save icon.
This automatically creates and saves a file in a *.CSV (comma-separated values) format using the following naming structure:
C:\CUBASE\CUBASE/Resources\data\####.csv
#### is the panel number of the screen from which the data was downloaded
The \Data sub-folder will be created automatically if it does not already exist, under the C:\GOLD application directory on your PC. This folder is only used for these downloads and will not even exist until you perform your first export.
IMPORTANT: CU*BASE will automatically overwrite any existing file with that same file name (there is no confirmation message). It is recommended that after the download is complete you copy or move the file to another secure location with an appropriate file name.
This file is just a simple, plain text file that can easily be opened with Windows Notepad or many other PC applications. There is no special layout formatting and there are no graphs. You will need to use the tools and procedures of your chosen application to work with the data in this file.

|
Analytics Booth as Visual Analytics Tools
|
Not a subscriber? Learn more in the CU*Answers Store.
Analytics Booth is a stand-alone product for credit union leaders and data analysts to use for a multitude of data points. While not a VAT proper, the same principals and ideas have been a part of the product since its inception, through showing daily trends through line graphs, and showing graphic interfaces over selected data points.

|
Work smarter, not harder. The Asterisk Intelligence team brings you a team of analysts who work to interpret your data for insights and opportunity. Tools like Analytics Booth, Report Builder (Query), Dashboards, Visual Analytical Tools (VAT), and Unique Data Management (UDM) give the power to see and control your database. Then we work with you to maximize the benefit of these solutions in the context of our five pillars of data analytics – Finance, Operations, Fraud, Audience, & Marketing. For more information on the Asterisk Intelligence team and what their perspectives and expertise can bring to your credit union, contact them at ai@cuanswers.com, by phone at 1-800-327-3478 ext 870, or visit the Asterisk Intelligence Store at https://store.cuanswers.com/asterisk-intelligence/ |