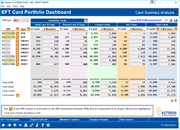
EFT Card Portfolio Dashboard
| Screen ID: | IEFTCRD-01 | 
|
| Screen Title: | EFT Card Portfolio Dashboard | |
| Panel ID: | 4964 | |
| Tool Number: | 594 | |
| Click here to magnify |
Access this screen by selecting Tool 594 Portfolio Analysis - EFT Usage.
Dashboard Tips – Questions to Ask When Comparing a Dashboard with Another Dashboard or Report
Introduction
This data is populated on the second day of the month. Because this data is as of end of month, the data will not change during the course of the month.
The EFT Card Portfolio Dashboard allows you to review statistics on your credit, debit and ATM data. This first screen allows you to view by BIN the number of cards and the number of members for cards. (Due to, for example, co-signers and joint owners, there can easily be more cards than members in each category.) This data is as of end of month, and this is noted in the section at the bottom of the screen.
If a BIN is highlighted, that indicates that the BIN is suspended. Members may still have cards from this BIN, but no new cards can be created.
Data is available on this screen for cards:
-
Used in the lasts 30 days
-
Unused in the last 30 days
-
Closed cards
-
Hot Cards
-
Total cards
Totals
at the bottom of the screen show totals for ATM, debit, credit and total
cards - for both number of cards and number of members.
-
NOTE: The Total number of members may not add up to the member totals listed in each row, as the unique member will be counted only one time in the final total.
Using this Screen
There are so many opportunities for further exploring, analyzing, and using this data from this screen. Review the listing below for more information.
-
Select what BINs you view (ATM, debit, credit or all).
-
At the top left of the screen, use the BIN type selector to view only credit, debit or ATM cards. The totals at the bottom will reflect these selections.
-
-
Sort the data on the screen ascending and descending by column.
-
The header of each column allows you to sort the data by that column. Click on the header to sort ascending or descending. You can sort by number of cards or number of members for each grouping and by the BINs themselves. Sort by BIN to find your most popular BIN, for example.
-
-
View transaction data for a specific BIN.
-
Use the
 buttons next to the
BINs to drill down to the BIN Transaction
Analysis, which allows you to view transaction data by year.
-
-
Analyze groups of members to see their relationship with your credit union. Look for opportunities to form new relationships.
-
Click on the numbers in the "# Members" columns (for example members who used their cards in the last 30 days) perform and analysis of this group of members. You will access a screen that allows you to select to view information about these members' memberships or accounts. View data on the relationships these people have with your credit union, for example, how many products and services they have, how many email addresses you have, and what kind of balances they have.
-
-
View transaction data across all EFT platforms.
-
Use Transaction Analysis (EFT Trx Analysis) to a move to an analysis of the number of transactions and dollar amount of these transaction across credit card, debit card SIG, ATM/debit card PIN and total.
-
-
Communicate with your members or analyze their account information in Report Builder.
-
Use the arrow buttons to access a screen which allows you to export either the account numbers for use with Member Connect or the account details for use with Report Builder. Use Member Connect as an opportunity to reach out to different groups of members to send them emails and online banking messages.
-
-
View data on unused cards.
-
Use Unusedto view data on your unused cards, including data on cards that have been unused for longer than 30 days.
-
-
View Data Sources for this dashboard.
-
Use Data Source to view the tables and columns that are used to generate the information for this analysis.
-