EFT Transaction Analysis
| Screen ID: |
ITRNEFT-04 |
|
| Screen Title: |
EFT Transaction Analysis |
|
| Panel ID: |
5014 |
|
| Tool Number: | 594 | |
| Click here to magnify |
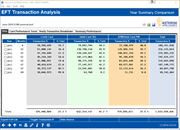
This screen appears when you select EFT Trx Analysis on the EFT Card Portfolio Dashboard.
Create full-color PDFs of the data and charts on the screen – PDF Exports
Learn about downloading data and charts to Excel or a comma-delimited file
Dashboard Tips – Questions to Ask When Comparing a Dashboard with Another Dashboard or Report
This data is populated on the second day of the month. Because this data is as of end of month, the data will not change during the course of the month.
This dashboard
lists additional detail of transaction information for all BINs (credit,
debit and ATM) from the previous screen.
This the total number of transactions and total dollar amount for
debit, credit and ATM BINs by year.
Using this Screen
Select a row and Select to view the detail for that year.
To toggle between total and percentage data, use Totals/Percentages .
View the tables and columns used to derive the data for analysis by selecting Data Source.
