Loan Portfolio Analysis
| Screen ID: | IGLBGT11-02 | 
|
| Screen Title: | Current Portfolio - Loans | |
| Panel ID: | 5838 | |
| Tool Number: | 595 | |
| Click here to magnify |
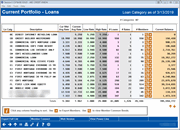
This screen appears after selecting an option on the initial selection window.
This tool gives a quick a snapshot of your entire loan portfolio. This tool is the easiest and best way to get a picture of your rates across all member accounts. The “organize by” selection you made on the initial window controls what appears in the first two columns of the dashboard.
Click any column heading to sort the list by any column (click again to toggle between ascending and descending order). Use the  button in the # Members column to export this specific group of members so that you can communicate with them via Member Connect. Use the
  button in the # Members column to see Common Bonds analyses for these specific members.
A Word About Online Credit Cards
If you have online credit cards, the system will include all of the rates from the individual rate “buckets” (purchases, balance transfers, and cash advances) found on each individual account. For credit cards as well as other loans, the weighted average rates are calculated using the actual outstanding balance for each rate.
A Word About Written-Off Loans
This dashboard will automatically exclude written-off loans, but the method by which that is done depends on how the data is organized, based on the selection you made on the initial window:
-
If organized by Budget Group/GL Acct, Loan Category, or Business Unit, loans are omitted if the Loan Category config uses interest calc type 2 (no interest calculated).
-
If organized by Purpose Code or Security Code, loans are omitted if the written-off flag on the loan account record is set to “on” (1).
Although it is rare, there might be situations where an individual loan account record is out of synch with the way your loan categories and G/Ls are configured, causing a written-off account to appear in one view but not when the data is organized a different way.
Analytics Booth: Power Line and Web View
Launching the Web View (F22) dashboard will provide additional tools to subscribers to analyze data that can only be found in Analytics Booth, including more screen real estate to view more data at one time, different filters and graphics, and new ways to understand the data. Non-subscribers will be presented with a splash page.
Use the Power Line (F23) button to launch an immediate trend line graph in Analytics Booth to help you better understand your data.
Not a subscriber? Learn more in the CU*Answers Store.

|
Check out this video: Analytics Booth at a Glance |
Calculating Weighted Average Rates
The following sample illustrates how the system calculates the Weighted Average Rate and the Average Rate for this dashboard:

Note: Average Rate is calculated by adding all of the rates for all accounts and dividing by the number of accounts. So in the sample above the average rate would be 4.150%.