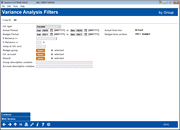
Variance Dashboard - Filters
| Screen ID: | IGLVAR-01 | 
|
| Screen Title: | Variance Analysis Filter | |
| Panel ID: | 5916 | |
| Tool Number: | 936 | |
| Click here to magnify |
This screen appears after making two selections on the Budget Snapshots pop-up window.
-
For complete instructions on configuring, creating, viewing and analyzing your budget, refer to the Budgeting with CU*BASE booklet.
The Variance Dashboard is the ultimate payoff for all your hard work entering budget figures into CU*BASE. Although similar to the Budget Dashboard tool that you use while working on the budget, which compares your budget to last year, this tool is unique in that it compares your plan (budget figures) to your performance (actual figures for the same year).
-
This means that you shouldn’t really use this dashboard until after February 1, when you have at least one set of month-end actual figures to compare!
The filters on this initial window let you focus on just the portion of your performance you wish to monitor. For example, you could use the Variance > $ or Variance > % filters to look only at G/Ls where the variance from your budgeted figures is large enough to warrant investigation or a report to your Board. Or look just at your income or expense budget groups, or even select a single G/L account to review its YTD performance.
When ready, use  or press Enter
to proceed to the Variance Dashboard screen.
Analytics Booth: Web Version
Launching the Web Version (F22) dashboard will provide additional tools to subscribers to analyze data that can only be found in Analytics Booth, including more screen real estate to view more data at one time, different filters and graphics, and new ways to understand the data. Non-subscribers will be presented with a splash page.
Not a subscriber? Learn more in the CU*Answers Store.
Field Descriptions
All filters are “AND” conditions, meaning the records must meet all of the specified conditions to be displayed on the dashboard.
|
Field Name |
Description |
|
G/L type |
Choose one of the standard G/L account types (Income or Expense). Or use the Net Income option to combine both income and expense G/Ls, with handy sub-totals as well as a net income summary total. Choosing this is the fastest way to verify the budget figures pertaining to your income statement. |
|
Actual period |
Enter the starting period you wish to view in the current year. |
|
Budget period |
Enter the starting and ending period for the portion of the current year you wish to view. (Even if the year is not complete, you can enter an ending period of December.) This is useful if you want to analyze variances for just a single quarter or even a single month of the year.
|
|
Variance > $ |
Use this to view only budget groups or G/L accounts with variances (meaning the budget compared to actual) that are greater than or equal to the specified dollar amount. Enter a whole dollar amount.
IMPORTANT: Both of the Variance ($ or %) threshold filters are applied at the group/aggregate level, meaning if Budget Group 01 has a total variance over your threshold, then it will be included in the list when the dashboard first displays. If you drill down on Budget Group 01, all of that group’s GLs will still be listed, even those that don’t happen to hit the threshold themselves. Likewise, if a specific G/L account hits the threshold, it will be included on the list (at the second drill-down level). When you drill in to see the branches, all branches will be listed even if some of them don’t hit the threshold individually. |
|
Variance > % |
Use this to view only budget groups or G/L accounts with variances (meaning the budget compared to actual) that are greater than or equal to the specified percentage. Enter whole percentages (no decimal places).
|
|
Jump to GL acct |
Use this to show only G/Ls equal to or higher than this account number. For example, if you enter 90100 here, only account numbers 901-00 to 999-99 will be included on the subsequent dashboard screens. This might be useful in conjunction with another filter, such as G/L type, to narrow into a specific region of your G/L. |
|
Budget group |
Use this to view only certain Budget Groups on the dashboard. Use the Select button to choose one or more of your configured groups. The main advantage of this is if you want the totals on the dashboard to reflect only a particular type of G/L in your budget (such as only your Investment Income G/Ls, for example), which can be handy for a quick ballpark check on how your budget figures are coming out so far. |
|
G/L account |
Use this to view only certain G/Ls on the dashboard. Use the Select button to choose one or more of your configured accounts. |
|
Branch |
Use this to view only certain branches on the dashboard. Use the Select button to choose one or more of your configured branch locations. |
|
Group desc contains |
This filter is not currently used. |
|
Account desc contains |
This filter is not currently used. |