Budget Dashboard
| Screen ID: | UGLBGT4-02 | 
|
| Screen Title: | Budget Dashboard | |
| Panel ID: | 5561 | |
| Tool Number: | Multiple | |
| Click here to magnify |
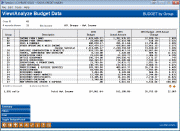
This screen appears after choosing filters and using Continue on the initial View/Print Budget Analysis screen.
The primary purpose of the Budget Dashboard is to help you keep track of the progress of your budgeting calculations. Although similar to the Variance Dashboard, the Budget Dashboard is intended primarily to verify the numbers on your budget spreadsheet.
-
IMPORTANT: For complete step-by-step instructions on configuring and using CU*BASE budgeting tools, refer to the Budgeting with CU*BASE booklet. Below are a few tips on specific screen functions that may be helpful when using this dashboard:
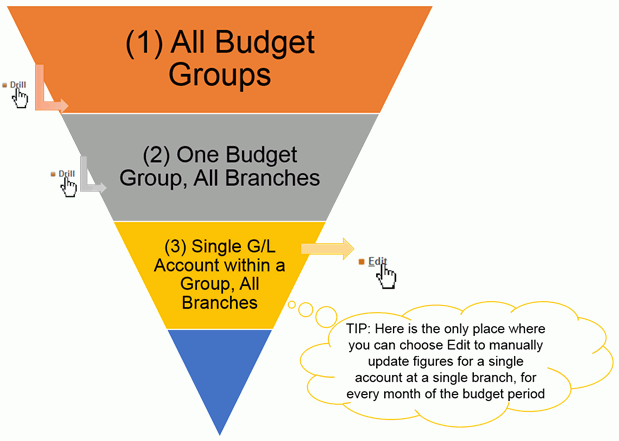
Budget Drill-Down Illustration
It is helpful to familiarize yourself with how this same Budget Dashboard screen can show your budget figures at three different “levels” or groupings. You can view figures aggregated by Budget Group, or drill down and look at all of the G/Ls within that Budget Group (branches combined), or drill down to the final level showing individual branches for a single G/L. It is at that bottom level where you can also edit your monthly budget figures manually if you wish (see *NOTE below).

Working with Items on the Dashboard
|
Drill to Account |
These appear on the upper levels of the dashboard, and allow you to select a budget group or a G/L account and drill down to a more granular level. You must drill down to the final level that lists your branches in order to use the Edit feature. |
|
Once you’ve drilled to the lowest level that lists your branches, use this to adjust individual monthly figures for that branch G/L.
|
|
|
Use this to view month-by-month budget figures for any Budget Group, G/L account, or branch G/L.
|
Buttons
|
Buttons |
Description |
|
Filters (F9) |
Use this to view or change the filters that control what records are displayed on the dashboard, including the budget year.
|
|
Summary (F10) |
Use this to view a summary window showing the number of accounts, percent budgeted, and total budget amount by G/L type.
|
|
Print (F14) |
Use this on any dashboard screen to print a report showing the same data you are currently viewing. (There is no confirmation window; the report prints directly to your default report printer.) |
|
Toggle Budget/Actual (F20) |
Use this to switch the contents of the second column between showing actual and budget figures for the year designated as Comparison period on the initial filters screen. |