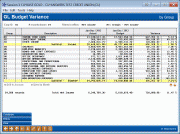
Variance Dashboard
| Screen ID: | IGLVAR-02 | 
|
| Screen Title: | GL Budget Variance | |
| Panel ID: | 5542 | |
| Tool Number: | 936 | |
| Click here to magnify |
This screen appears after specifying filters and using Enter on the initial Filters window.
For complete instructions on configuring, creating, viewing and analyzing your budget, refer to the Budgeting with CU*BASE booklet.
The Variance Dashboard is the ultimate payoff for all your hard work entering budget figures into CU*BASE. Although similar to the Budget Dashboard tool that you use while working on the budget, which compares your budget to last year, this tool is unique in that it compares your plan (budget figures) to your performance (actual figures for the same year).
-
This means that you shouldn’t really use this dashboard until after February 1, when you have at least one set of month-end actual figures to compare!
The most common technique for accessing this dashboard is by choosing the Net Income option on the initial filters window. When the screen first displays, then, you’ll see a simple summary showing a sub-total of income and expenses and a calculated net income total, like this:

To see the detail for these totals by Budget Group, use the Expand button at the bottom of the screen.
If your Budget Groups were set up properly (see the Budgeting with CU*BASE booklet for some advice), this dashboard can function as an online Income Statement.
Special Tips
-
Above the list you’ll see a summary of which G/L accounts you are currently viewing, and whether any filters are currently in effect (use the Filters button to see them). Remember that the totals at the bottom of the list only reflect these specific accounts. So if you specified filters in order to show only specific data, the totals will not reflect your entire net income!
-
The Variance ($ or %) threshold filters are applied at the group/aggregate level, meaning if Budget Group 01 has a total variance over your threshold, then it will be included in the list when the dashboard first displays. If you drill down on Budget Group 01, all of that group’s GLs will still be listed, even those that don’t happen to hit the threshold themselves. Likewise, if a specific G/L account hits the threshold, it will be included on the list (at the second drill-down level). When you drill in to see the branches, all branches will be listed even if some of them don’t hit the threshold individually.
-
The first column of figures shows your actual figures for the selected year (usually the current year), up to and including the most recent month-end. So if you are viewing this dashboard in June, you’d see January through May figures represented.
Sorting the Variance Dashboard
If you selected Net Income on the initial filters window, the records will be in order by budget group sequence # and you will not be able to re-sort the list by clicking the column headings. But if viewing all G/Ls or a specific G/L type (such as expenses only), you will be able to click any column heading to sort by that column.
-
TIP: The color varies by theme, but using the standard theme, column headings that are orange can be clicked to sort; gray column headings cannot.
Click once to sort items in ascending order (lowest number at the top). Click again to change to descending order (highest number at the top). Notice that credit-balance GLs are treated as negative numbers in this context.
Working with Items on the Dashboard
|
Drill to Account |
These appear on the upper levels of the dashboard, and allow you to select a budget group or a G/L account and drill down to a more granular level. Click here for an illustration explaining the 3 different levels you’ll see. |
|
Use this to view month-by-month budget figures for any Budget Group, G/L account, or branch G/L.
|
Buttons
|
Buttons |
Description |
|
Expand / Condense (F8) |
Available only after selecting “Net Income” on the initial filters screen, this toggles the display between showing only income and expense sub-totals and displaying all budget groups in addition to the sub-totals. |
|
Filters (F9) |
Use this to view or change the filters that control what records are displayed on the dashboard. |
|
Print (F14) |
Use this on any dashboard screen to print a report showing the same data you are currently viewing. (There is no confirmation window; the report prints directly to your default report printer.) |
|
Web Version (F22) |
Launching the Web Version (F22) dashboard will provide additional tools to subscribers to analyze data that can only be found in Analytics Booth, including more screen real estate to view more data at one time, different filters and graphics, and new ways to understand the data. Non-subscribers will be presented with a splash page. Not a subscriber? Learn more in the CU*Answers Store. |