Targeted Tiered Services Summary Analysis
| Screen ID: | ISERV1-06 | 
|
| Screen Title: | Targeted Tiered Scoring Analysis | |
| Panel ID: | 5415 | |
| Tool Number: | 840 | |
| Click here to magnify |
Access this screen after selecting your criteria on the previous screen and using Enter.
Dashboard Tips – Questions to Ask When Comparing a Dashboard with Another Dashboard or Report
-
For more information, refer to the Tiered Services implementation guide booklet.
Introduction
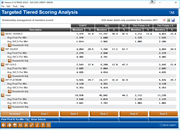
This dashboard reports results based scoring from the previous month, so data will not change throughout the current month. To see the other filters used by the dashboard, click Show Selects at the bottom of the screen.
On this view how members that fit your selected criteria on the previous screen compare to your general membership across Tiered Service levels.
-
The targeted Tiered Services Summary Analysis dashboard is similar to the Tiered Services Monthly Summary Comparison except that it allows you to analyze the participation of a specific segment of your membership by Tiered Service scoring.
-
The second to last column shows a count of members with zero (or less than zero) Tiered Services points for that month. (It is very infrequent that a member would have a negative score, but these members are included in this column.) The last column shows a count of members who have greater than zero Tiered Services points. You can set members with written off loans to score with zero points.
-
NOTE: If credit score is selected, the dashboard uses the value in the credit score (CHSCORE) field in the CSCBSH file.
-
The average products per member and average services per member figures) are configured on the Calculating Products and Service screen in Tiered Services.
-
Understanding the columns with a percentage sign: There are several columns with a percentage sign at the top of the column. For the *ALL column, this is a percentage of the total number (count) of memberships at your credit union. For all other columns, this number reflects the percentage of the number listed in the "Total" line at the bottom of the section, as shown in the example below. For example, in this case, the count in this section (# of members for the section) is divided by 15,121.

Use Enter or use the Goal buttons at the bottom of the screen to move to screens showing data on the five goals for Tiered Services.
You can click the lookup next to the tier name to “drill down” to a detail screen to see more data about the members in your selected group for the selected month. If your credit union uses the household scoring method, click the lookup next to "Household Adj" to view a breakdown of members according to the scores assigned by household for the selected month. If you drill down to the member level, this allows you to access the New/Closed Membership dashboard and New/Closed Accounts dashboard for more big data information on your selected members.