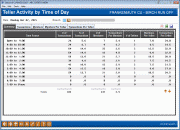
Teller Activity by Time of Day (from Month)
| Screen ID: | ITLDAY-01 | 
|
| Screen Title: |
Teller Activity by Day of Month |
|
| Panel ID: | 5017B | |
| Tool Number: | 844 | |
| Click here to magnify |
Access this screen by selecting a specific branch on the Teller Activity Day of Month screen and selecting the lookup next to a day of the month.
Create full-color PDFs of the data on the screen – PDF Exports
Learn about downloading data to Excel or a comma delimited file
How are the “Totals” calculated on each Teller Activity (by Day/Week/Month) dashboards?
-
SEE ALSO: Teller Cash & Activity Analysis Tools
Introduction to the Screen
This allows you to analyze the best day on the month. Was it because it was a Monday or a Friday? Or because it was the 1st, the 15th or the 30th? What effect does the calendar have on your lobbies and how members need your services? Does it change from month to month? What would you like your team to understand about what happened last month?
The point of trends is whether or not you can avoid negative situations or recreate positive ones. With a little insight, can you figure out your tactics for next month? And the month after that?
-
Remember that data for these tools will be generated during BOD on the second business day of the month. Since we use end-of month data from the previous month, you will need to wait a little while longer to see data from the last month.
The Mechanics
The summary screen displays transaction counts for each day selected at the top of the screen.
The # of Transactions is the number of actual transactions processed, and # of Members is the number of actual members represented by those transactions. (Obviously if a member does transactions at different times during the day, or at different branches, the same member would be included in more than one of the counts. The idea here to see the number of members that were served, regardless of who they were.)
The # of Tellers column shows the total number of employees that were involved in posting teller transactions on the dates listed. The system looks at the number of unique employee IDs in the teller statistical file; counts are available starting with April 2006 data.
NOTE: The date and time relate to the physical host system processing the transactions and not the workstation.
Graphical Views
Use the remaining tabs to view the data on the summary screen in a graphical format.