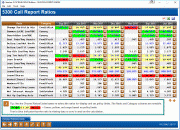
5300 Call Report Ratios Dashboard (2)
|
Screen ID: Screen Title: Panel Number: |
UN53RAFM-02 5300 Call Report Ratios 3994 |
This screen is accessed after selecting the dates press Enter from the entry screen.
Dashboard Tips – Questions to Ask When Comparing a Dashboard with Another Dashboard or Report
5300 Call Report Ratio calculations are viewed on this dashboard. The columns of period data will appear in the order the Periods were entered on the previous screen. If you see calculated ratios highlighted in red, yellow, or green then policy limits have been defined on the Policy Limits screen. A red score represents exceptions to credit union preferences, a yellow score is getting close to credit union preferences, and a green score is well within the credit union’s expectations.
Click  to move to the screen
which shows the ratio calculation,
result and category. A list of the 5300 Call Report Account Codes used
in the calculation are also shown.
If the ratio is blank, then key data required for the ratio calculation is missing. Click on the spyglass button next to the ratio to view a description of the ratio along with the Account Codes used. For example, on CommercialRElLoans/RBC, if Account Code A718A “Portion of RE Loans also rpted as bus loans” is missing, then the ratio will be blank.
If the ratio has blue text , then one or more of the Account Codes used
in the calculation is blank or zeroes, but is not key in calculating
the ratio. For example, on Net Chgofs/Avg Loans, if A550 “Total YTD Charge
Offs” is blank, the calculated ratio will display with blue text. It
does not mean that the ratio calculation is wrong, it merely indicates
that not all the Account Codes included in the calculation were used.
To verify the ratio calculation, click  to move to the screen which shows the Account
Codes and associated amounts used in the ratio calculation.
History on Canary Ratios: Back in 1999, the Office of the Comptroller of the Currency (OCC) unveiled “Project Canary”. Like the role of the canary in the mining industry, this project was created to provide an early-warning system to enable regulators to identify financial institutions with excessive risk. The goal of “Project Canary” was to develop a series of benchmark risk ratios that could be calculated from Call Report data. The results help identify those institutions that might be growing too rapidly, accepting an immoderate level of risk, relying too heavily on volatile short-term funding, or exposing themselves to significant asset/liability pricing and interest rate risk.
Buttons
|
Button |
Description |
|
Use this to access the Choose My Ratios screen where 1) you indicate the ratios that you would like to be calculated and viewed on the dashboard or 2) view/update the goal and policy limits for the ratio. |
