Teller Activity by Time of Day
| Screen ID: | ITLTOD-01 | 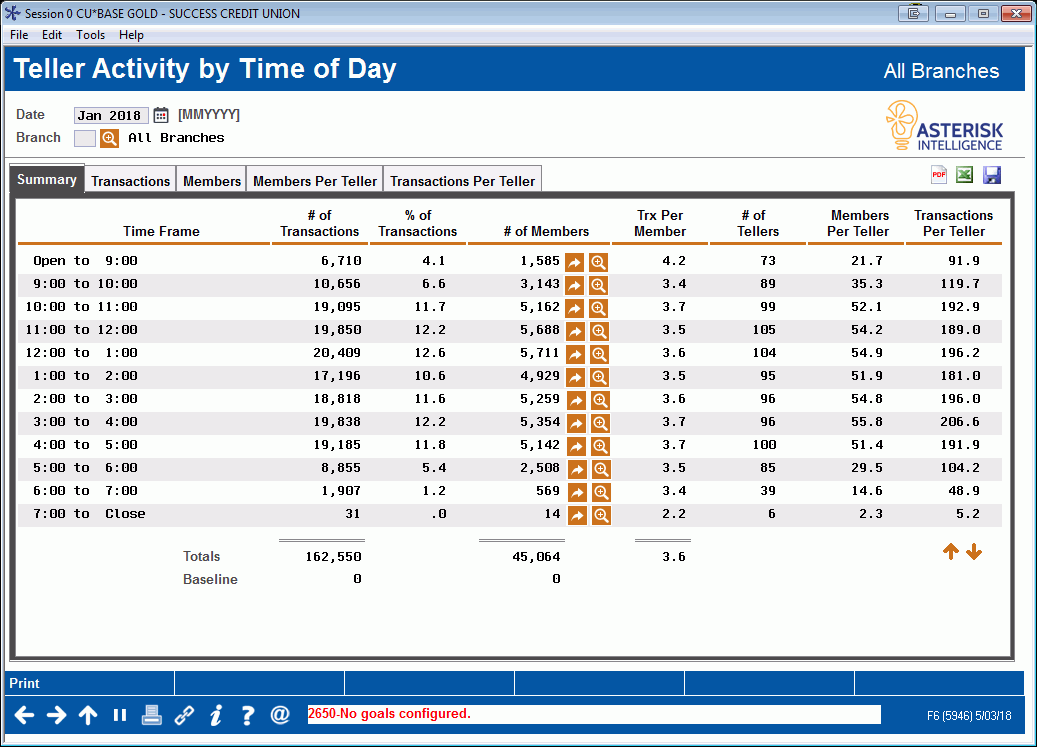
|
| Screen Title: |
Teller Activity by Time of Day |
|
| Panel ID: | 5946 | |
| Snap Shot: | þ
As of Month End ¨ Right Now |
|
| Tool Number: | 846 | Click here to magnify |
Access this screen by selecting Tool #846 Teller Activity by Time of Day. Another time of day dashboard is here.
-
NOTE: Because this dashboard uses data from a snapshot at the end of the month, activity during the current month will not be included.
-
Remember that data for these tools will be generated during BOD on the second business day of the month. Since we use end-of month data from the previous month, you will need to wait a little while longer to see data from the last month.
-
SEE ALSO: Teller Cash & Activity Analysis Tools
Create full-color PDFs of the data on the screen – PDF Exports
Learn about downloading data to Excel or a comma-delimited file
How are the “Totals” calculated on each Teller Activity (by Day/Week/Month) dashboards?
Dashboard Tips – Questions to Ask When Comparing a Dashboard with Another Dashboard or Report
About the Tool
This tool gives you a quick visual of when the bulk of your teller activity occurs during a typical day. Again, this is not so much an employee scheduling tool as a “big picture” view of member behavior patterns that might prompt some new ideas and creative thinking as to how you could meet your member needs even more effectively.
-
All of the teller activity that is analyzed comes from transactions that hit the teller drawer. The data does not show any transactions that do not affect the teller drawer, such as transfers using Proc Code “T” or corporate check/money order withdrawals, nor do they include strictly cash transactions (cash-for-cash).
The Mechanics
The summary screen shows transaction counts starting with the first transaction of the day (”Open”) to 9:00 a.m. and continuing in one hour time increments until the block from 7:00 p.m. until the last transaction of the day (“Close”).
NOTE: The date and time relate to the physical host system processing the transactions and not the workstation.
Use the Date field at the top of the screen to display data from a different time period. Data is available starting with April, 2004, activity (teller counts from April 2006). Select any heading to sort the data by the selected column.
To view transactions for a single branch only, enter the number into the Branch field at the top of the screen (press Enter to refresh the screen). Use 00 to combine all branches together. This system uses the branch as recorded on the transaction record, meaning the teller branch where the transaction was posted.
The # of Transactions is the number of actual transactions processed, and # of Members is the number of actual members represented by those transactions. (Obviously if a member does transactions at different times during the day, or at different branches, the same member would be included in more than one of the counts. The idea here to see the number of members that were served, regardless of who they were.)
-
The # of Tellers column shows the total number of employees that were involved in posting teller transactions during the times listed. The system looks at the number of unique employee IDs in the teller statistical file MATLRTOD. Counts are available starting with April 2006 data.
Buttons
|
Button |
Description |
|
Print (F14) |
Select this to go to the Teller Activity Reporting screen where you can print a report of this data. |