Sampling Transaction Activity by Delivery Channel (2)
| Screen ID: |
ITRDTL-02 |
|
| Screen Title: |
Member Analysis - Transaction Activity |
|
| Panel ID: | 4539 | |
| Tool Number: | 775 | |
| Click here to magnify |
Access this screen by using the ![]() button on the initial Member
Analysis - Transaction Activity screen.
button on the initial Member
Analysis - Transaction Activity screen.
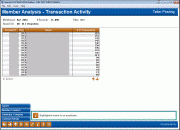
Use this screen as a comparison tool to determine accurate transaction ranges for your Origin groups. The Origin code descriptions come from the MAORIGSEQ file.
The system counts all transactions from the chosen origin code (i.e., 01 for teller processing, 02 for share drafts, etc.) for all credit union members that had any activity last month, then lists them in order by number of transactions. All columns are sortable by clicking on the header row. Select a member and Select to view a detail of that member.
Use Summary Compare (F9) to move to the Transaction Activity Summary Compare dashboard, which will help you in figuring out your transaction ranges for Abnormal Activity Monitoring. For detailed information and step-by-step instructions on the Abnormal Activity Monitoring tool, including tips on how to group members or determine normal activity levels, refer to the "Abnormal Activity Monitoring" booklet.
Field Descriptions
|
Field Name |
Description |
| Branch | The branch number (or all branches) for which you’d like to view activity, including abnormal activity |
| Transaction type | The transaction type (analysis method) for which you’d like to view activity, including abnormal activity. |
| Account # |
The member’s account number |
| Name | The member’s name |
| # of Transactions | The number of transactions the member made from the chosen origin code (i.e., 01 for teller processing, 02 for share drafts, etc.) during the last month |
Button
|
Button |
Description |
|
Export (F9) |
Use this to create a file of these members for use with Report Builder (Query) or Member Connect. |
|
Member Connect F10) |
Use Export (F9) to create a list of accounts. Then use this feature to send these members emails or online banking message. |
|
Summary Compare (F11)
|
Brings you to the Transaction Activity Summary Compare dashboard, which will help you in figuring out your transaction ranges for Abnormal Activity Monitoring |
|
Common Bonds (F12) |
Analyze this based on what they have in common – what accounts they all have, what membership characteristics the have, how their credit scores compare, or how their Tiered Service scoring compares. |
