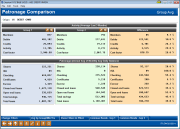
Patronage Comparison (3)
| Screen ID: | IPATCM-03 | 
|
| Screen Title: | Patronage Comparison | |
| Panel ID: | 5449 | |
| Tool Number: | 582 | |
| Click here to magnify |
Access this screen by selecting  for a transaction origin analysis on the previous screen.
Because this data is as of end of month, the data will not change during the course of the month.
The third screen in the Patronage Comparison provides a deeper look at analyzing the two groups for the selected delivery channel/transaction origin. In the top half of the screen, the system display activity information for both groups and then shows the difference between the two (amount and percent difference).
By default, the screen will look at the monthly average over the last three full months for the group. For example, in April the screen will review the EOM balances for January-March, and average those amounts to give the group average. Use Avg by Group/Mbr/Trx (F8) once to toggle to the Per Member Avg (for example, when looking at the last three months, what is the average amount per member per month for that transaction origin). Use the toggle one more time to see the Per Transaction Avg.
The bottom half provides more information on the two groups in terms of their patronage. Depending on the display (Group/Member/Transaction) this section will display information about member balances. Per Group Avg will show the average aggregate balance at EOM for that group in the categories of Shares, IRA, Checking, Escrow, Closed end loans, Open end loans, Total savings, and Total Loans. Per Member Avg takes that aggregate balance divided by the Members listed for that group. Per Transaction Avg will not display balance information for the two groups.
Why do the number of members differ from the previous screen?
You may notice upon entering this screen that the number of members representing each group is less than what was shown on the previous screen. On the previous screen, where all selected transaction origins are displayed, the system calculates the total number of unique members that had transactions for any of those selected origins. However, for any individual origin, there may be fewer individuals that performed those types of transactions during the analysis period. For example, if all members of that group used a debit card, but only half used the teller line, the number of members for the teller origin would be half that of the previous screen.
Reviewing Common Bonds
From this screen, you can also review the common bonds of the members for either group using the Membership and Account Analyses, as well as the Credit Score History dashboard. Select the Common Bonds button for either Group 1 or 2 and then select the type of analysis for the group you'd like to review and press Go!
Buttons
|
Buttons |
Description |
|
Access the first screen of the Patronage Comparison to modify the groups. |
|
|
Avg by Group/Mbr/Trx (F8) |
Toggles between three different views of the information: Group Avg - reviews last three EOMs and averages the amounts to give a monthly average for the entire group. Per Member Avg - takes the group average divided by the number of members that performed a transaction for that specific delivery channel over the last three full months. Per Transaction Avg - takes the group average divided by the average number of transactions per month. |
|
Access an inquiry only screen with the group filters that were selected. |
|
|
Common Bonds - Grp 1 |
Access a selection screen to perform a common bonds analysis on the select group. Select from either Membership traits, Account composition, or Credit history trends. |
|
Common Bonds - Grp 2 |
Access a selection screen to perform a common bonds analysis on the select group. Select from either Membership traits, Account composition, or Credit history trends. |