Printing the Risk Score Analysis Report
|
Screen ID: Screen Title: Panel Number: Report Name: |
LRISK-01 Loan Risk Score Analysis Report 866 LRISK2 |
Access this screen by selecting Tool #679 Print Risk Score Analysis Report.
-
NOTE: This data is also available on the Loan Risk Scored Analysis Dashboard. The dashboard has a similar entry screen but allows you to select your delinquency status (day ranges) and includes trending across multiple comparison dates. (More risk score ranges, too!)
Practical uses of this report:
Use this report to see if your risk matches your reimbursement or if you need to adjust your credit score ranges.
This report is a must for anyone who currently uses risk based pricing. Use it to compare the performance of your risk based pricing with your loan performance. See if your risk matches your reimbursement. Do you need to adjust your credit score ranges or adjust your variance (the amount you add to the base rate for any risk score range)?
This report breaks delinquent loan accounts down into the delinquency aging categories defined by your credit union. In addition, the report will show a separate category for current (non-delinquent) loans as well as a category including all credit union loans, whether delinquent or not.
-
NOTE: Delinquency aging categories are defined using the Collection Parameter Configuration.
Using the Filters
On this screen you can define up to 8 risk score ranges, to group the loans within each aging category according to the risk score on the loan account record.
-
Select to view All loans, or just the credit union portion, or just the investor portion.
-
Optionally select to include all or just selected business units, loan categories, loan purpose codes, loan security codes, branch location numbers, Loan Officer IDs, and dealer IDs. Use the Select button to view a list of items. Select an item or hold down the Ctrl key and select multiple items or use Select All (F9) to select all selections. Then use the Select option to return to the report generation screen. Use the filters on the top of the screen to narrow your selection – see filter directions.
-
Optionally break on loan category. Just check the Break on loan category box (next to loan category) and the resulting report breaks by page for each loan category with sub totals at the bottom of each page.
-
Optionally select to include “Written off” loans (by default they are excluded). The screen will retain the last parameters used to make it easier the next time the report is run.
-
Check “Export to file” to a screen where you can enter a filename and export more data to use with Report Builder.
IMPORTANT NOTE: This report previously did not include accounts that did not have a risk score. Now, the report results include all accounts, even those with a zero risk score. Scores over 900 are now considered a zero score and are included with the zero score information. Refer also to the Collections Delinquency Report or the Delinquent Loan Analysis Report.
Report Sample
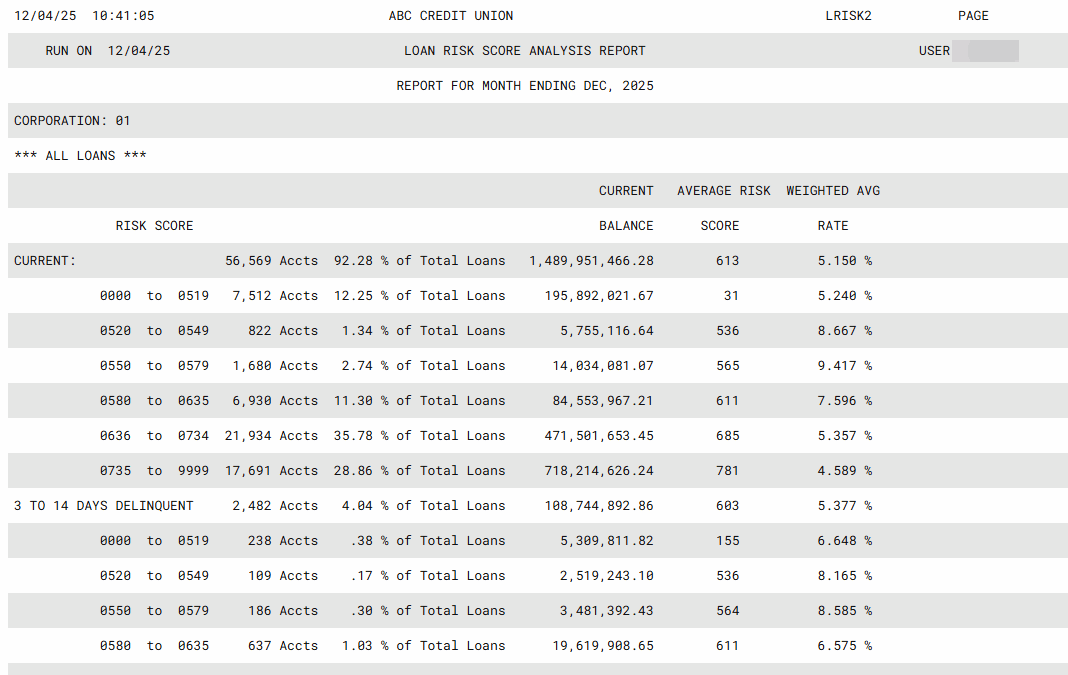
Notice that this sample credit union only uses all eight available aging categories. Under each aging category you'll see the selected risk score ranges, and statistics on the number of delinquent accounts within each range.
The “Current” group represents all loans that are either current (non-delinquent loans) or loans that have been delinquent fewer days than the configured minimum number of days in the lowest aging level (found on the Delinquency Aging Levels Definition screen). For example, “Current” on this report might include all loans that are delinquent fewer than five days.
The “All Loans” group represents all outstanding loans, both delinquent and current, where a risk score has been recorded. The remaining groups are taken from the credit union's collection parameters, and may include up to eight delinquency aging categories.
-
Remember that this report includes all loans, even those with a zero risk score recorded on the loan account record.
How Do I Save/Retrieve My Report Settings?
For more details on setting up this feature, refer to the Automating Reports and Queries booklet, available on the CU*BASE Reference page.
This report can be used with the “Report Scheduler,” a time-saving automation feature that allows you to select and save the filters you use to run several commonly used reports and then set these reports to be run automatically by our operations staff on the first of the month. Or you can save the settings and run them manually by yourself at any time.
To save your report settings, first select your filters, including printer (can be a physical printer or the HOLDxx or MONTHxx OUTQs). Then select Save Settings. On the next screen name your settings (we recommend adding your name!), and designate whether you wish to run this manually or if you wish for operations to run the report. At a later time, use Retrieve Settings to populate the screen with the settings you have saved. You can also edit your settings using Retrieve Settings. All saved settings can be viewed on the Report Automation: Standard Reports screen.
Report Sample
